|
I will preface this with, I am not a DBA. I've run PostgreSQL databases off and on for the past 8 years, but I'm not a full-time DBA. I don't follow all of the ins and outs and daily updates with PGSQL. I'm a simple bit pusher who runs a few dozen DB's. And with that out of the way..... I got an alarm last week about high disk usage on one of our PostgreSQL database instances. This was really odd as we've never seen a high disk alarm on them before. Also, it was just the master that was alarming; none of the replicas were alarming even though they have identically-sized drives. If the DB data were truly growing quickly, every machine would alarm. So I checked the DB size graphs in OpenNMS and sure enough, they were OK: 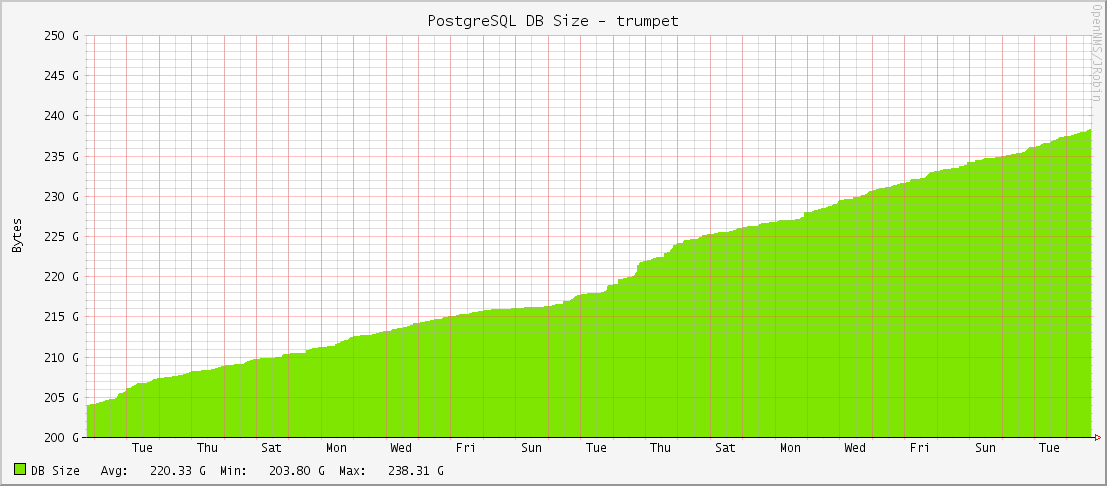 These are 1.6TB drives so nothing wild going on here. Running du in the pg_data directory showed that pg_xlogs were responsible for all of the new disk usage. But why? None of the WAL and checkpoint settings had been changed in months. Nothing new in the output logs. After searching high and low about the actual calculations for retaining WAL files (most of them are wrong including the official docs), I came to the conclusion that our WAL and checkpoint settings were not responsible for the high disk usage. But what was?
|
AuthorA NOLA native just trying to get by. I live in San Francisco and work as a digital plumber for the joint that runs this thing. (Square/Weebly) Thoughts are mine, not my company's.  Moi Archives
May 2021
Categories
All
|
 RSS Feed